Statistics is often taught as a set of dry formulas and calculations, but in the real world, statistical methods help us understand patterns, trends, and important events happening around us every day. One of the best ways to teach statistics is to connect it to meaningful real-world information — and weather is a perfect example.
Using weather data to teach statistics
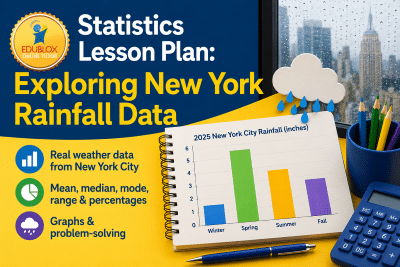
In this lesson, students explore real rainfall data from New York City in 2025 and use it to investigate important statistical concepts, including mean, median, mode, range, percentages, and graphs. Instead of working with random numbers disconnected from reality, students analyze authentic weather data collected by meteorologists. This immediately gives mathematics more meaning and helps students understand why statistics matter.
The lesson also combines mathematics with geography and climate science. Students learn that rainfall patterns are affected by seasons, weather systems, and geographic location. They discover that spring was the wettest season in the dataset, while winter showed the lowest rainfall totals, although snowfall was not included in the data. This creates valuable opportunities for discussion and critical thinking.
Developing problem-solving skills
Real-world statistics lessons also help students develop problem-solving and reasoning skills. Students are asked to organize data from smallest to largest, calculate averages, determine percentages, and create colorful bar graphs to visually represent information. By working step by step with authentic information, students begin to see statistics not as isolated calculations, but as tools for understanding the world.
Importantly, lessons like these can make mathematics more engaging for struggling learners. Weather is familiar, visual, and constantly changing, making it easier for students to stay interested and emotionally connected to the work. Combining statistics with topics such as geography, seasons, and climate also helps students see how different subjects connect.
Why statistics matter
Statistics is becoming increasingly important in modern life. Weather forecasting, sports analysis, medical research, economics, social media trends, and even artificial intelligence all rely heavily on data analysis and statistical reasoning. Helping students understand statistics through meaningful, real-world examples prepares them not only for school mathematics but also for interpreting information critically in everyday life.
When students work with real data, mathematics becomes more than numbers on a worksheet. It becomes a way to explore, understand, and explain the world around them.