
IQ stands for intelligence quotient; the average IQ score is 100. IQ test scores are often expressed as percentiles, which differ from percentage scores, and this is a common source of misunderstanding about IQ test scores. Some say an IQ score gives a good indication of the occupational group a person will end up in. Others disagree since it is doubtful that such a thing as general intelligence exists. It is necessary to be cautious when using a descriptive classification of IQs. An IQ score is, at best, a rough measure of academic intelligence that can be improved.
Table of contents:
- The beginning of IQ testing
- IQ test scores explained
- IQ scores expressed in percentiles
- IQ, job performance, and occupation
- One intelligence or many?
- Interpret with caution!
- Increasing IQ: The Glenwood State School
- Key takeaways
The beginning of IQ testing
Intelligence testing began in earnest in France when, in 1904, psychologist Alfred Binet was commissioned by the French government to find a method to differentiate between intellectually normal children and those who were inferior. The purpose was to put the latter into special schools. There, they would receive more individual attention and could avoid disrupting the education of intellectually normal children.
This led to the development of the Binet Scale, also known as the Simon-Binet Scale, in recognition of Théophile Simon’s contribution. The test had children do tasks such as following commands, copying patterns, naming objects, and putting things in order or arranging them properly. Binet gave the test to Paris schoolchildren and created a standard based on his data. Following Binet’s work, the phrase “intelligence quotient,” or “IQ,” entered the vocabulary.
Lewis M. Terman worked on revising the Simon-Binet Scale. His final product, published in 1916 as the Stanford Revision of the Binet-Simon Scale of Intelligence (also known as the Stanford-Binet), became the standard intelligence test in the United States for the next several decades.
By the 1920s, mass use of the Stanford-Binet Scale and other tests had created a multimillion-dollar testing industry. By 1974, according to the Mental Measurements Yearbook, 2,467 tests measuring some form of intellectual ability were in print, 76 of which were identified as strict intelligence tests. In one year in the 1980s, teachers gave over 500 million standardized tests to students across the United States. In 1989, the American Academy for the Advancement of Science listed the IQ test among the twenty most significant scientific discoveries of the century, along with nuclear fission, DNA, the transistor, and flight.
Today, the most commonly used individual IQ test series is the Wechsler Adult Intelligence Scale (WAIS) for adults and the Wechsler Intelligence Scale for Children (WISC) for school-age test-takers.
IQ test scores explained
Although the IQ test industry is already a century old, IQ scores still need to be understood. Comments like the two below are not unusual and indicate a complete misunderstanding of IQ scores:
- “What do you mean my child isn’t gifted — he got 99 on those tests! That’s nearly a perfect score, isn’t it?”
- “The criteria you handed out says ‘a score in the 97th percentile or above.’ Jane got an IQ score of 97! That meets the requirement, doesn’t it?”
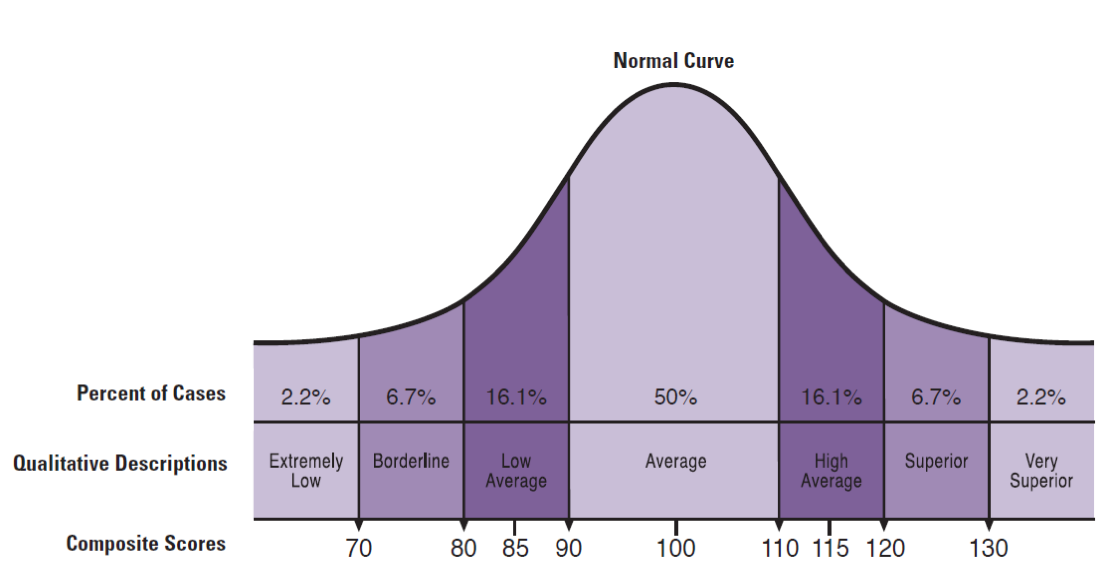
IQ stands for intelligence quotient. Supposedly, it is a score that tells one how “bright” a person is compared to others. The average IQ is, by definition, 100; scores above 100 indicate a higher-than-average IQ, and scores below 100 indicate a lower-than-average IQ. Theoretically, scores can range from any number below or above 100. In practice, however, they do not meaningfully go much below 50 or above 150.
Half of the population has IQs of between 90 and 110, while 25% have higher IQs and 25% have lower IQs:
,
| IQ | Description | % of Population |
|---|---|---|
| 130+ | Very superior | 2.2% |
| 120–129 | Superior | 6.7% |
| 110–119 | High average | 16.1% |
| 90–109 | Average | 50% |
| 80–89 | Low average | 16.1% |
| 70–79 | Borderline | 6.7% |
| 69 and below | Extremely low | 2.2% |
.
Below is a graphic representation of the above:
.
IQ scores expressed in percentiles
IQ test scores are often expressed as percentiles, which differ from percentage scores, and this is a common source of misunderstanding about IQ test scores. A percentage refers to the number of items a person answers correctly compared to the total number of items presented. For example, if a person answers 25 questions correctly on a 50-question test, they would earn a 50% score. If they answer 40 questions on the same test, their percentage score would be 80.
Percentile, however, refers to the number of other test takers’ scores that an individual’s score equals or exceeds. For example, if a person answered 25 questions and ranked in the top 50% of test takers, he would score at the 50th percentile. However, if he answered 40 questions on the 50-item test and everyone else answered more than he did, he would fall at a very low percentile — even though he answered 80% of the questions correctly.
On most standardized tests, an IQ of 100 is at the 50th percentile. Most IQ tests are standardized, with a mean score of 100 and a standard deviation of 15. What that means is that the following IQ scores will be roughly equivalent to the following percentiles:
.
| IQ | Percentile |
| 65 | 01 |
| 70 | 02 |
| 75 | 05 |
| 80 | 09 |
| 85 | 16 |
| 90 | 25 |
| 95 | 37 |
| 100 | 50 |
| 105 | 63 |
| 110 | 75 |
| 115 | 84 |
| 120 | 91 |
| 125 | 95 |
| 130 | 98 |
| 135 | 99 |
An IQ of 120, therefore, implies that the testee is brighter than about 91% of the population, while an IQ of 130 puts a person ahead of 98% of the population. A person with an IQ of 80 is brighter than 9% of people, and only a few score below 60.
IQ tests, job performance, and occupation
Over the past century, numerous studies have documented the link between cognitive assessment scores and employee performance. In a chapter advocating the principle that employers should ‘‘select on intelligence,’’ Schmidt and Hunter state (2000):
Intelligence is the major determinant of job performance, and therefore hiring people based on intelligence leads to marked improvements in job performance – improvements that have high economic value to the firm.
The industrial psychology literature has reached consensus on the explanation for the strong IQ–job performance relationship: more intelligent individuals (as measured by IQ scores) learn job-relevant knowledge faster and more effectively, resulting in improved job performance (Byington & Felps, 2010).
According to some authors, an IQ score gives a good indication of the occupational group a person will end up in, though not the specific occupation. For example, in their book, Know Your Child’s IQ, Glen Wilson and Diana Grylls outline occupations typical of various IQ levels:
.
| 140 | Professors and Research Scientists. |
| 130 | Physicians and Surgeons; Lawyers; Engineers (Civil and Mechanical). |
| 120 | School Teachers; Pharmacists; Accountants; Nurses; Stenographers; Managers. |
| 110 | Foremen; Clerks; Telephone Operators; Salesmen; Policemen; Electricians. |
| 100+ | Machine Operators; Shopkeepers; Butchers; Welders; Sheet Metal Workers. |
| 100- | Warehousemen; Carpenters; Cooks and Bakers; Small Farmers; Truck and Van Drivers. |
| 90 | Laborers; Gardeners; Upholsterers; Farmhands; Miners; Factory Packers and Sorters. |
.
Many scholars disagree since it is doubtful that such a thing as general intelligence exists. Intelligence is an encompassing term. Many people feel that intelligence includes creativity, persistent curiosity, and success. Consider, for example, that James Watson, the discoverer of DNA, has an IQ of about 115, about the IQ of most college students. He claims that his great success was due to his persistent curiosity, something not measured by IQ tests.
IQ tests are poor indicators of many attributes of this nature. Generally, IQ tests seem to measure common skills and abilities, most of which are acquired in school. Thus, in opposition to the idea of general intelligence, the concept of “multiple intelligences” came into being.
One intelligence or many?
Undoubtedly, the man who stands out from the crowd for formally introducing the idea of multiple intelligences was L.L. Thurstone (1887-1955). Thurstone was a mathematician hired to work in Thomas Edison’s laboratory. Thurstone soon became aware that Edison seemed utterly unable to comprehend mathematics. This led Thurstone to conclude that, rather than a single quality called general intelligence, there must be many kinds of intelligence, perhaps each unrelated to the other. Thurstone believed that if a person was intelligent in one area, it didn’t necessarily mean he would be smart in another.
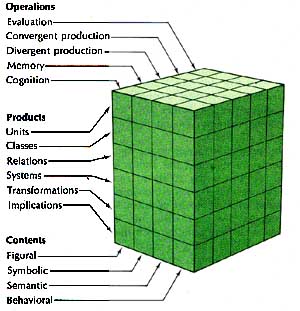
Based on his factor analysis of the human intellect, J. P. Guilford developed an intelligence model. In Guilford’s Structure of Intellect (SI) theory, intelligence comprises operations, contents, and products. There are six kinds of operations (cognition, memory recording, memory retention, divergent production, convergent production, and evaluation), six types of products (units, classes, relations, systems, transformations, and implications), and five kinds of contents (visual, auditory, symbolic, semantic, and behavioral). Since each of these dimensions is independent, there are theoretically 180 components of intelligence.
Harvard Professor Howard Gardner suggests that there are at least eight different types of intelligence, which are
- Verbal-linguistic intelligence (“word smart”)
- Logical-mathematical intelligence (“number/reasoning smart”)
- Visual-spatial intelligence (“picture smart”)
- Musical intelligence (“music smart”)
- Bodily-kinesthetic intelligence (“body smart”)
- Interpersonal intelligence (“people smart”)
- Intrapersonal intelligence (“self-smart”)
- Naturalist intelligence (“nature smart”)
.
Gardner says that our schools and culture focus most of their attention on verbal-linguistic and logical-mathematical intelligence. As a result, we esteem our culture’s highly articulate or logical people. However, Gardner says we should pay equal attention to individuals who show gifts in the other intelligence types.
The theory of multiple intelligences proposes a major transformation in how our schools are run. It suggests that teachers be trained to present their lessons in various ways, using music, cooperative learning, art activities, role-play, multimedia, field trips, inner reflection, and much more.
Interpret with caution!
It is necessary to be cautious when using a descriptive classification of IQs. IQ is, at best, a rough measure of academic intelligence. It would certainly be unscientific to say that an individual with an IQ of 110 is of high average intelligence while an individual with an IQ of 109 is only of average intelligence.
Furthermore, we need to consider that individuals may vary in their test scores from one test to another. The scores may vary by as much as 15 points from one test to another, while emotional tension, anxiety, and unfamiliarity with the testing process can significantly affect test performance. In addition, Gould described the biasing effect that tester attitudes, qualifications, and instructions could have on testing.
In one study, 99 school psychologists independently scored an IQ test from identical records and came up with IQs ranging from 63 to 117 for the same person. In another study, Epps et al. examined the extent to which professionals could differentiate learning-disabled (LD) students from ordinary low achievers by reviewing patterns of scores on psychometric measures. Subjects were 65 school psychologists, 38 special-education teachers, and a “naive” group of 21 university students enrolled in programs unrelated to education or psychology.
Provided with forms containing information on 41 test or subtest scores (including the WISC-R IQ test) of nine school-identified LD students and nine non-LD students, judges were instructed to indicate which students they believed were learning disabled and which were non-learning disabled. The school psychologists and special education teachers were able to differentiate between LD students and low achievers with only 50% accuracy. On the other hand, the naive judges, who had never had more than an introductory course in education or psychology, achieved a 75% hit rate!
Measures of intelligence may be valuable, but much harm can be done by persons who try to classify individuals based on such criteria alone. No one should be either alarmed or discouraged if he finds that his IQ is not as high as he might have hoped. Remember that many elements besides IQ contribute to success and happiness. Also, note that IQ is not a fixed quantity but can be increased through education. An experiment at the Glenwood State School and numerous other research studies demonstrated this.
Increasing IQ: The Glenwood State School
Research on the role of the environment in children’s intellectual development has shown that a stimulating environment can dramatically increase IQ. In contrast, a deprived environment can lead to a decrease in IQ.
An exciting project on early intellectual stimulation involved 25 children in an orphanage. These children were seriously environmentally deprived because the orphanage was crowded and understaffed. Thirteen babies of an average age of 19 months were transferred to the Glenwood State School for intellectually disabled adult women, and each baby was put in the personal care of a woman. Skeels et al., who conducted the experiment, deliberately chose the most severely deprived orphans to be placed at the Glenwood School. Their average IQ was 64, while the average IQ of the 12 who stayed behind in the orphanage was 87.
At the Glenwood State School, the children were placed in open, active wards with older, relatively brighter women. Their substitute mothers overwhelmed them with love and cuddling. Toys were available, they were taken on outings, and talked to a lot. The women were taught how to stimulate the babies intellectually and elicit language from them.
After 18 months, the dramatic finding was that the children who had been placed with substitute mothers and therefore received additional stimulation, on average, showed an increase of 29 IQ points! A follow-up study was conducted 2.5 years later. Eleven of the 13 children originally transferred to the Glenwood home had been adopted, and their average IQ was now 101. The two children who had not been adopted were reinstitutionalized and lost their initial gains. The control group, the 12 children who had not been transferred to Glenwood, had remained in institution wards and now had an average IQ of 66 (an average decrease of 21 points).
However, more telling than the increase or decrease in IQ is the difference in the quality of life these two groups enjoyed. When these children reached young adulthood, another follow-up study brought the following to light:
The experimental group had become productive, functioning adults, while the control group, for the most part, had been institutionalized as mentally retarded.
Other examples of IQ increases through early enrichment programs are found in Israel, where children of European Jewish heritage have an average IQ of 105. In contrast, those with a Middle-Eastern Jewish heritage are said to have an average IQ of only 85. Yet, when raised on a kibbutz, children from both groups have an average IQ of 115.
In another home-based early enrichment program in Nassau County, New York, an instructor showed parents participating in the program how best to teach their children at home. The children in the program had initial IQs in the low 90s, but by the time they entered school, they averaged 107 or 108. In addition, they have consistently demonstrated superior ability on school achievement tests.
.
Key takeaways
Edublox provides support for students with dyslexia, dyscalculia, and other learning difficulties. We help students worldwide overcome academic challenges and reach their full potential. Book a free consultation to discuss your child’s learning needs and discover how we can help.
.
References and sources:
- Anastasi, A. (1966). Testing problems in perspective. Washington DC: American Council on Education.
- Byington, E., & Felps, W. (2010). Why do IQ scores predict job performance?: An alternative, sociological explanation. Research in Organizational Behavior, 30.
- Clark, B. (1988). Growing up gifted (3rd ed.). Columbus: Merrill.
- Dworetzky, J. P. (1981). Introduction to child development. St. Paul: West Publishing Company.
- Engelbrecht, S. Kriegler & M. Booysen (Eds.) (1996). Perspectives on Learning Difficulties. Pretoria: J. L. van Schaik.
- Engle, T. L., & Snellgrove, L., (1974). Psychology: Its principles and applications (6th ed.). New York: Harcourt Brace Jovanovich, Inc.
- Epps, S., Ysseldyke, J. E., & McGue, M. (1984). ‘I know one when I see one’ — Differentiating LD and non-LD students. Learning Disability Quarterly, 7, 89-101.
- Gould, S. J. (1981). The mismeasure of man. New York: W. W. Norton.
- Osgood, R. L. (1984). Intelligence testing and the field of learning disabilities: A historical and critical perspective. Learning Disability Quarterly, 7, 343-348.
- Sattler, J. (1982). Assessment of children’s intelligences and special abilities. Boston: Allyn & Bacon.
- Schmidt, F. L., & Hunter, J. E. (2000). Select on intelligence. In E. A. Locke (Ed.), Handbook of principles of organizational behavior (pp. 3–14). Oxford, UK: Blackwell.
- Skeels, H. M., Updegraff, R., Wellman, B. L., & Williams, H. M. (1938). A study of environmental stimulation: An orphanage preschool project. University of Iowa studies: Studies in Child Welfare, 5.
- Smith, C. R. (1991). Learning disabilities: The interaction of learner, task, and setting. Boston: Allyn and Bacon.
- Swiegers, D. J., & Louw, D. A. (1982). Intelligensie. In D. A. Louw (Ed.). Inleiding tot die psigologie (2nd ed.). Johannesburg: McGraw Hill.
- Wilson, G., & Grylls, D. (1977). Know your child’s IQ. London: Futura Publications..